Announcing Matrix XII: An $800M fund to invest from concept to Series A Read more


I recently released Part 1 results of the annual SaaS Survey which shared data and insights on growth rates, go-to-market trends and cost structure. A new highlight in Part 1 of this year’s results includes data on balancing growth and profitability in SaaS companies, commonly known as The Rule of 40%.
This post covers Part 2 of the results, which dives into:
We’ve also published the forEntrepreneurs 2016 SaaS Survey Infographic! The infographic pulls together major takeaways from the SaaS Survey and ties in advice for founders on relevant metrics.

67% of participants use third parties predominantly (3/4 of which was AWS). Expectations for the future show little change as third party application delivery continues to gain popularity. The trend toward using third party public cloud is huge (mostly AWS). Self managed is down from 37% last year to 33% this year and the percentage planning to use AWS three years from now increased from 44% last year to 64% this year.

When filtered by company size, smaller respondents reported more frequent use of third-party providers as their primary application delivery method, while the largest companies were more likely to use self-managed servers.
(Excluding Companies <$2.5MM in Revenue)

Median subscription gross margins did not appear to vary much when filtered by SaaS application delivery method (note that Salesforce data is sparse).

This year’s results appear somewhat counterintuitive. Larger companies’ accounting shows operating costs as a greater percentage of revenue.
For data on cost structure and “The Rule of 40%”, see Part 1 of the survey results.

The median annual contract size (subscription component only) for the group was $25K per year. These results are somewhat above the previous survey medians of $21K, $21K, $20K in 2015, 2014 and 2013, respectively.

The phenomenon of longer contract terms for larger contracts is pretty clear. Companies in the “elephant hunter” group are less aggressively booking super long-term contracts. Respondents with >$250K median ACV book nearly 25% of their contracts at 3 years or longer (down from 35% in the 2015 group).
(Excluding Companies <$2.5MM in Revenue)
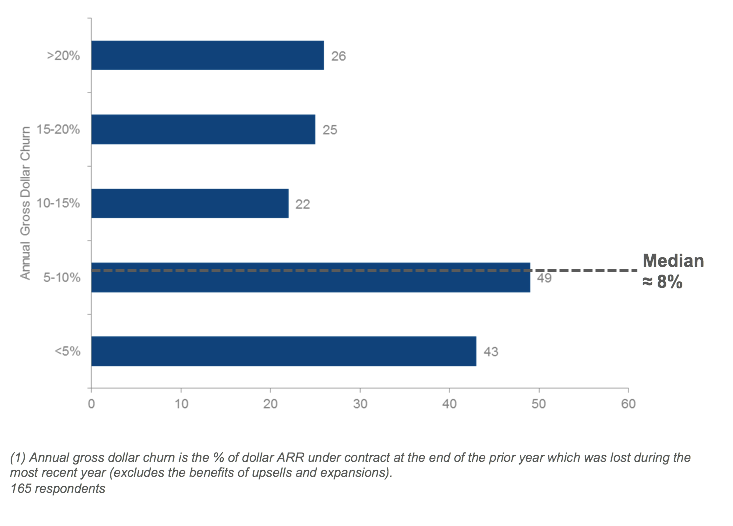
Median annual gross dollar churn (without the benefit of upsells) is ~8%. This result is comparable to past survey results (7% in 2015, 6% in 2014, 8% in 2013).
(Excluding Companies <$2.5MM in Revenue)

As with unit churn, companies with longer contracts (2+ years) tend to report lower annual dollar churn. Companies with shorter contracts (under 2 years) saw increased dollar churn compared to last year; contracts 2 years or longer were relatively consistent with prior survey results.
(Excluding Companies <$2.5MM in Revenue)

By definition, non-renewal rates are higher than gross dollar churn rates. However, it is interesting to see that the non-renewal rates are also higher for shorter duration contracts.
(Excluding Companies <$2.5MM in Revenue)

As contract sizes increase, gross dollar churn consistently trends downwards (presumably related to longer contract terms). This year’s results were largely consistent with last year’s. However, churn trended up markedly for the smaller size contract groups (<$5K median ACV).
“How much do you expect your ACV from existing customers to change, including the effect of both churn and upsells?”(1)

The median annual net dollar retention rate, including churn and the benefit of upsells, is 102%. The result does not change materially when removing the smallest companies (<$2.5MM in revenue) form the group. These results are largely consistent with the past two years’ results (2015: 104% and 2014: 103%).
In other posts on forEntrepreneurs, I have referred to the situation where you have a greater 100% net dollar retention as “negative churn”. For those interested in learning out to achieve negative churn, this slide deck may be of interest: The Key Drivers for SaaS Success.

The 2016 respondents have less revenue traction per dollars raised than previous years’ groups.

(Excluding Companies <$2.5MM in Revenue)
“When do you typically begin recognizing subscription revenues on a new contract with a new customer?”

Approximately 53% of respondents indicated they begin recognition very soon (within a week or two) after signing new contracts. It’s interesting to see that many companies with significant services were still able to start subscription revenue recognition quickly. A greater percentage of companies are recognizing subscription revenue “a few months or more after signing”; 25% this year vs. 17% last year.
(Excluding Companies <$2.5MM in Revenue)
“How do you recognize sales commission costs (deferred or recognized up-front)?”

We also inquired as to the recognition of sales commission costs. We found ~3/4 of respondents indicate that they recognize costs up-front. Compared to previous surveys, there is a slight shift toward up-front recognition vs. 72% last year.
The benefit of recognizing revenue in a deferred manner is that you avoid missing your expense and profitability goals when you have a large bookings quarter. The downside is that it is more complex to maintain the commission tracking system. For more details you may find this post to be of interest: SaaS Sales Compensation: How to Design the Right Plan.We’d love to hear your responses below about this year’s survey results and what data would be useful to see included in future surveys. You can find benchmarks on growth trends, go-to-market strategy and cost structure in SaaS Survey Results — Part 1.
Check out the forEntrepreneurs 2016 SaaS Survey Infographic for takeaways and advice relevant to the metrics included in this year’s survey results.
I’d love to hear your thoughts and feedback on Part 2of the results. Please leave a response below!
If you enjoyed reading this, you may also be interested in the following posts:
This is a condensed version of a post originally published on forEntrepreneurs.
For more, follow us on Medium: Matrix Partners Viewpoints and on Twitter:@BostonVC and @Matrix Partners.